Material Behaviour & the Stress-Strain Graph
Snap a piece of glass and it shatters cleanly with almost no warning. Bend a copper wire too far and it stretches, thins, and eventually parts, but only after visibly deforming. Both fail under stress, yet their stress-strain graphs look nothing alike — and that shape tells you almost everything about how a material behaves up to fracture.
Reading a stress-strain graph
A stress-strain graph reveals distinct regions of behaviour as a material is stretched further, right up to failure.
The elastic region
At low stress, the graph is a straight line through the origin. This is the elastic region: stress is directly proportional to strain, so the material obeys Hooke's law, and deformation is entirely reversible — remove the stress here and the material returns exactly to its original dimensions. The gradient of this straight-line section is the Young modulus.
The limit of proportionality and the elastic limit
The straight line continues only up to the limit of proportionality — where the graph stops being straight. This isn't quite the same point as the elastic limit, which comes slightly after: between the two, the graph curves, but the material is still fully elastic. Only beyond the elastic limit does deformation become permanent. In many materials, especially ductile metals, the elastic limit is closely followed by a yield point, where the material suddenly extends considerably for little or no further stress increase, as internal atomic layers slip past one another.
The limit of proportionality is where the graph stops being a straight line. The elastic limit is a separate, slightly later point, beyond which deformation becomes permanent. A material can be non-linear — curving on the graph — while still being fully elastic anywhere between these two points.
Plastic deformation
Beyond the elastic limit, the material enters the plastic region. Deformation here is permanent — if stress is removed at any point in this region, the material springs back only partially, retaining some extension it never loses.
Ultimate tensile stress and fracture
As a ductile material stretches further through the plastic region, the stress it sustains rises to a peak, the ultimate tensile stress (UTS) — the highest point on the graph. This is where the material starts to neck: it thins visibly at one point, and since that thinner cross-section carries the same force over a smaller area, plotted stress can appear to fall past the UTS even though applied force stays roughly the same. The material finally separates at the breaking stress, typically lower than the UTS for ductile materials because of necking. For a brittle material, which shows negligible plastic deformation and no necking, the UTS and breaking stress are the same point.
Brittle and ductile behaviour
Materials show dramatically different amounts of plastic deformation before fracturing, splitting them broadly into two categories.
Brittle materials, such as glass or ceramics, show little or no plastic deformation before fracturing. Their stress-strain graph is close to a straight line almost to the breaking point — the elastic region extends nearly up to fracture. A brittle material fails suddenly, snapping cleanly rather than stretching or bending first.
Ductile materials, such as copper or gold, show substantial plastic deformation before fracturing. Their graph has a clear elastic region followed by an extended plastic region, often with a pronounced yield point, stretching considerably before reaching UTS, visibly necking, then separating at breaking stress shortly after. A ductile material gives plenty of visible warning before failure, which is why ductile metals are preferred for structural applications.
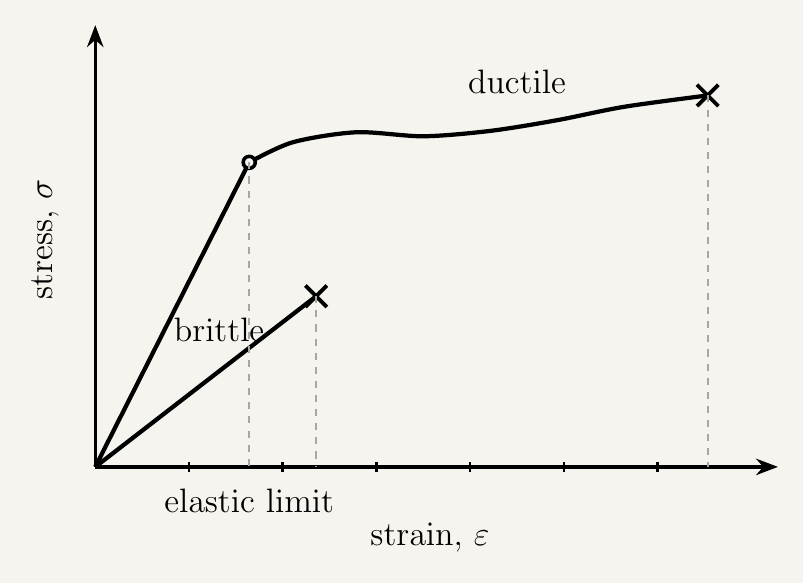
It's the shape of the curve, not just where it ends, that carries the physics. Two materials could have similar breaking stresses yet behave completely differently under load — one snapping with no warning, the other stretching visibly first — because what matters is how much is straight-line elastic behaviour versus curved plastic behaviour.
Key takeaways
- The elastic region of a stress-strain graph is a straight line through the origin, with gradient equal to the Young modulus; deformation here is fully reversible.
- The limit of proportionality (graph stops being straight) and the elastic limit (deformation becomes permanent beyond this point) are different points — a material can be non-linear yet still fully elastic between them.
- Many materials show a yield point shortly after the elastic limit, where extension increases sharply for little extra stress.
- Beyond the elastic limit, the material undergoes plastic deformation — permanent, non-reversible extension that remains even if the stress is removed.
- Ultimate tensile stress (UTS) is the peak stress on the graph; for ductile materials this is where necking begins, with fracture following at a separate, usually lower, breaking stress. For brittle materials the two coincide.
- Brittle materials (e.g. glass) show little or no plastic deformation and fracture suddenly, close to the end of their elastic region.
- Ductile materials (e.g. copper) show substantial plastic deformation, stretching considerably through a clear plastic region before eventually fracturing.