Resistivity
Two wires of the same metal but different lengths and thicknesses have different resistances — so resistance alone can't tell you what a material is like. Resistivity strips away the shape and size of a sample to get at the material property underneath.
The problem with resistance as a material property
Take two pieces of copper wire, one short and thick, the other long and thin. Measure the resistance of each and you'll get two different numbers, even though both are the same metal. A longer wire gives charge carriers more lattice to collide through, so it has more resistance; a thicker wire gives them more room to move through in parallel, so it has less. Resistance depends as much on a sample's geometry as on what it's made of.
That's a problem if what you want to know is how good a conductor copper is compared with nichrome or silicon. You need a quantity that strips the shape out entirely and leaves the intrinsic material property. That's resistivity.
Defining resistivity
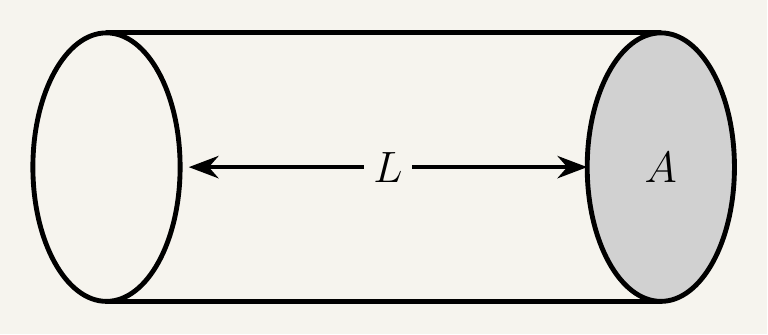
The relationship between a sample's resistance and its dimensions is simple: resistance is directly proportional to length and inversely proportional to cross-sectional area. Bundling the constant of proportionality into $\rho$ (rho) gives:
where $L$ is the length and $A$ the cross-sectional area. Because $\rho$ is what's left once length and area are accounted for, it depends only on the material (and its temperature), not the shape a sample was cut into. A thick wire and a thin wire of the same metal at the same temperature have the same resistivity, despite completely different resistances.
How resistance changes with temperature: metals
This is the same physics already met with the filament lamp, now described in terms of resistivity rather than resistance. In a metal conductor, charge carriers are free electrons drifting through a lattice of fixed positive ions. Raise the temperature and those ions vibrate more vigorously, presenting a bigger, more frequent obstacle to drifting electrons — more collisions, more resistance. So for a metal, resistance — and resistivity — increases as temperature increases. This holds for essentially every metal, and it's the same mechanism every time: more thermal vibration, more collisions, more resistance.
How resistance changes with temperature: NTC thermistors
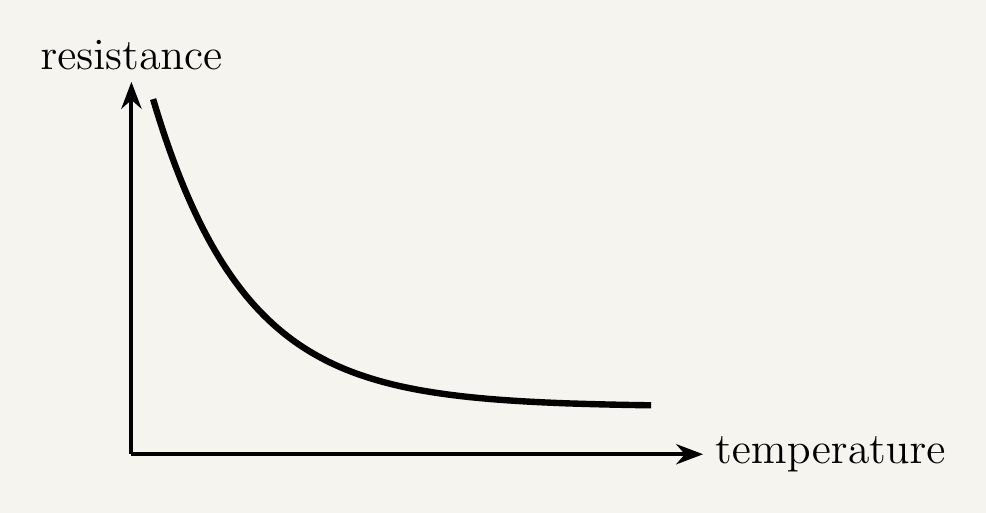
A thermistor behaves oppositely. A negative temperature coefficient (NTC) thermistor is made from a semiconductor, where the number of available charge carriers isn't fixed the way it is in a metal — it depends strongly on temperature. At low temperature, few electrons have enough energy to become mobile charge carriers; raising the temperature frees far more.
Both effects happen at once — more lattice vibration hindering carriers, as in a metal, but also many more carriers being freed. In a semiconductor, the second effect dominates: the huge increase in available carriers massively outweighs the modest increase in collisions. The net result is that resistance decreases sharply as temperature increases — the defining behaviour of an NTC thermistor, opposite to a metal.
This sensitivity makes thermistors useful as temperature sensors built into circuits — most directly as one half of a potential divider, converting a changing resistance into a changing, measurable voltage.
How resistance changes with light: the LDR
A light-dependent resistor (LDR) shows the same kind of behaviour as an NTC thermistor, triggered by light rather than heat. It's built from a semiconductor, and in the dark it has very few mobile charge carriers, so resistance is high. Shine light onto it, and photons transfer enough energy to free additional carriers — electrons are knocked loose, each leaving a positively charged "hole" that can also carry current, so light generates electron-hole pairs directly.
The brighter the light, the more photons arrive per second and the more electron-hole pairs are generated, so available carriers rise with intensity. Same logic as the thermistor: more carriers means more current for a given potential difference, so resistance falls as light intensity rises. Only the trigger has changed — heat in a thermistor, light in an LDR — the underlying "more carriers, less resistance" mechanism is identical.
This is what makes LDRs useful as light sensors, most commonly as one half of a potential divider whose output voltage swings with ambient light — the same role a thermistor plays for temperature.
Superconductivity: a different phenomenon altogether
Everything so far has been resistivity changing gradually with temperature. Superconductivity is genuinely different, not just an extreme version of the metal trend. Certain materials, cooled to or below a material-specific critical temperature, undergo a sudden transition in which resistivity drops to exactly zero. Below that temperature, current can flow through a superconductor indefinitely with no energy dissipated as heat.
This isn't just a laboratory curiosity. Superconducting electromagnets, cooled below their critical temperature, can sustain enormous currents without wasting energy as heat — exactly what makes the strong, stable magnetic fields in hospital MRI scanners possible. Superconductivity is also being explored for transmitting power with zero resistive loss, though currently limited by how cold most known superconductors need to be kept.
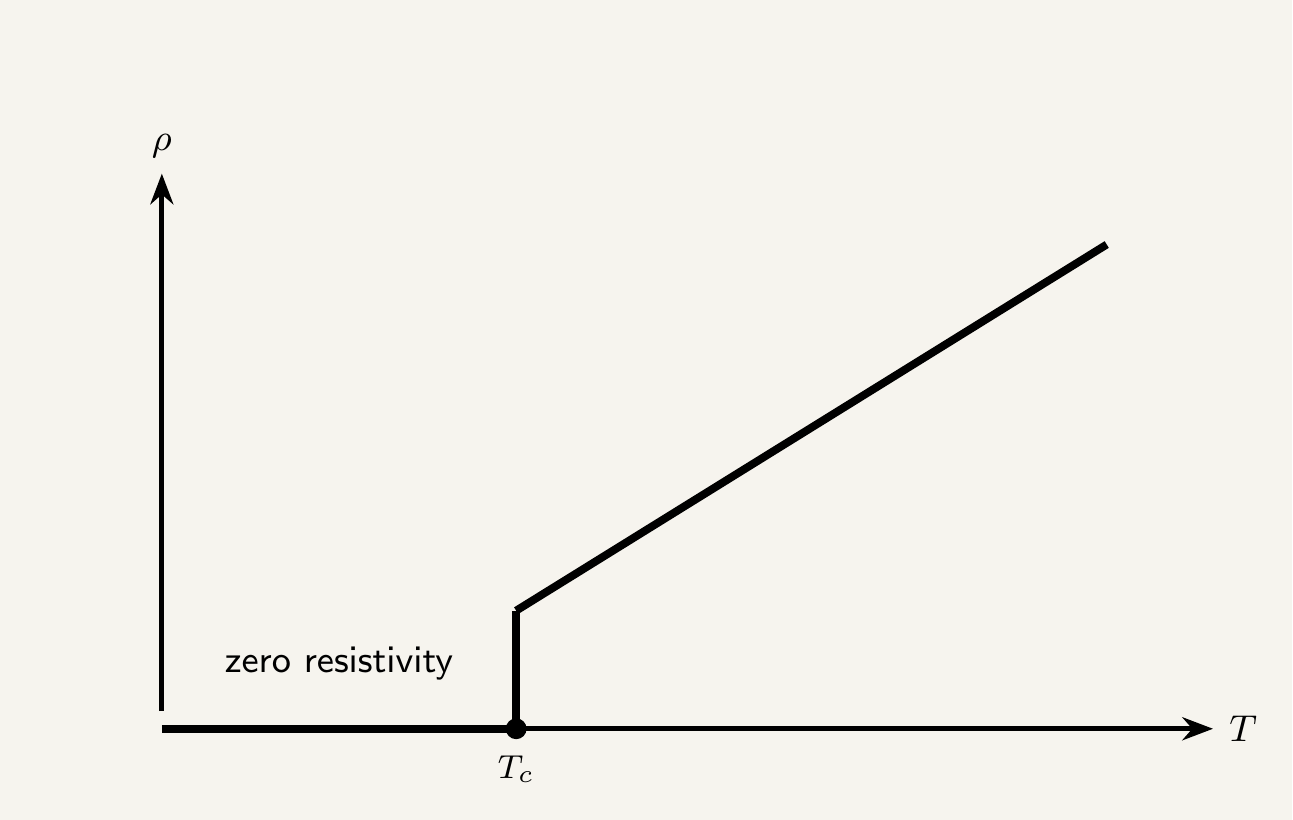
A normal metal's resistivity decreases smoothly as it cools but doesn't reach zero. A superconductor's resistivity drops abruptly to exactly zero at its critical temperature — a sudden phase transition, not a continuation of the same gradual trend.
Required Practical: Determination of the Resistivity of a Wire
This is AQA's Required Practical 5: determining the resistivity of a metal wire.
Equipment
| Equipment | Purpose |
|---|---|
| Test wire (e.g. constantan or nichrome) | The sample whose resistivity is being measured |
| Micrometer screw gauge | Measures the wire's diameter, since a ruler can't resolve it precisely enough |
| Metre ruler | Measures the length of wire between the crocodile clips |
| Ammeter | Measures current through the wire |
| Voltmeter | Measures potential difference across the measured length of wire |
| Variable resistor (rheostat) | Keeps the current low, to limit self-heating |
| Power supply, switch, crocodile clips, leads | Completes the circuit and allows quick, brief readings |
Method
Sources of error and how to minimise them
The clips and connections add a small, roughly fixed resistance that isn't part of the wire itself. Using the gradient of $R$ against $L$, rather than trusting one single $R$ value, cancels this out — a fixed contact resistance shifts the whole line up without changing its gradient.
A larger current makes the wire self-heat, which increases its resistance and biases the reading away from its resistance at a constant, known temperature. Keep the current low using the rheostat, and close the switch only briefly to take each reading.
A drawn wire is rarely perfectly uniform in cross-section. Measure and average the diameter at several points and orientations rather than assuming it's constant from a single measurement.
A layer of oxide on the wire's surface can add unwanted resistance at the clip contacts. Clean the wire with abrasive paper or emery cloth at the contact points before connecting the crocodile clips.
Key takeaways
- Resistance depends on a sample's length and cross-sectional area as well as its material, so it isn't itself a pure material property.
- Resistivity is defined by $R = \dfrac{\rho L}{A}$, rearranged to $\rho = \dfrac{RA}{L}$, and is measured in ohm-metres ($\Omega\,\text{m}$).
- A metal's resistance increases with temperature, because more lattice vibration causes more frequent collisions with drifting electrons.
- An NTC thermistor's resistance decreases with temperature, because the number of freed charge carriers increases far faster than collisions increase — the opposite trend to a metal.
- Thermistors are used as temperature sensors, and their changing resistance is often converted into a changing voltage using a potential divider.
- An LDR's resistance falls as light intensity rises, because absorbed photons free additional electron-hole pairs — the same "more carriers, less resistance" mechanism as a thermistor, triggered by light instead of heat.
- Superconductivity is a distinct phenomenon: below a material-specific critical temperature, resistivity drops to exactly zero, not just to a small value.
- Applications of superconductivity include generating very strong, stable magnetic fields (as in MRI scanners) and transmitting power with no resistive energy loss.
- The required practical measures $L$ with a ruler, $d$ (averaged over several points) with a micrometer, and $R$ by the ammeter-voltmeter method at low current, then finds $\rho$ either directly or from the gradient of an $R$ vs $L$ graph — watching for contact resistance, self-heating, and non-uniform diameter.