A velocity–time graph carries two pieces of information at once: the gradient and the area beneath it. Learn which is which and the graph will answer questions no formula was needed for.
10 min read3 worked examples
Gradient and area are the whole idea
A velocity–time graph plots an object's velocity against time. Unlike a displacement–time graph, it carries two useful pieces of information at once, which is what makes it the more powerful of the two motion graphs.
Both tools are live on this graph
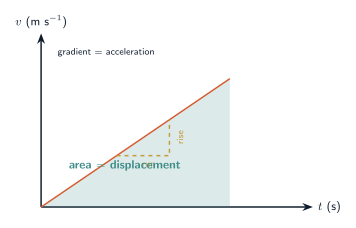
The gradient is $\dfrac{\text{change in velocity}}{\text{change in time}}$ — the definition of acceleration. So the gradient gives acceleration. And because velocity $\times$ time is displacement, the area beneath the graph gives displacement. Read the gradient for acceleration, read the area for displacement — never the other way round.
On a v–t graph the gradient gives acceleration and the shaded area beneath the line gives displacement — both readable from the same straight line.
What the shapes tell you
Horizontal line: constant velocity, zero acceleration.
Straight sloping line: constant acceleration — exactly the case the SUVAT formulae describe.
Curve: the acceleration itself is changing, so SUVAT does not apply.
Line crossing the time axis: the object changes direction at that instant, since velocity changes sign there.
Below the axis means going backwards
Negative velocity means motion in the negative direction, so area below the time axis counts as negative displacement. To find the total distance travelled rather than the displacement, add the areas as positive quantities; for displacement, subtract the parts below the axis. This is the same signed-area idea as integration, and questions exploit the difference.
Worked example 1
Distance from a velocity–time graph
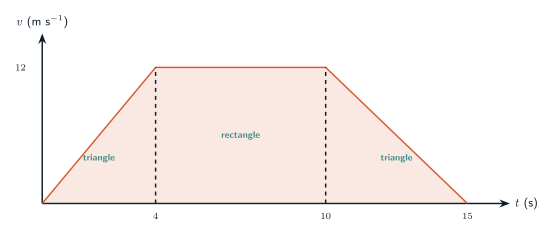
A car accelerates uniformly from rest to $12\ \text{m s}^{-1}$ in $4$ seconds, travels at that speed for $6$ seconds, then decelerates uniformly to rest in a further $5$ seconds. Find the total distance travelled and the deceleration in the final stage.
The three stages give a triangle, a rectangle and a triangle. Their areas add to the total distance.
MethodSketch the v–t graph; the area is the distance
1
The graph is a trapezium: a straight line from $(0,0)$ to $(4,12)$, a horizontal line to $(10,12)$, then a straight line down to $(15,0)$.
Uniform stages give straight lines.
2
Split the area into three. Stage 1 is a triangle: $\tfrac12 \times 4 \times 12 = 24$ m.
½ × base × height.
3
Stage 2 is a rectangle: $6 \times 12 = 72$ m.
Constant velocity.
4
Stage 3 is a triangle: $\tfrac12 \times 5 \times 12 = 30$ m.
Decelerating to rest.
5
Total distance $= 24 + 72 + 30 = 126$ m.
Sum of the areas.
6
The deceleration is the gradient of the last stage: $\dfrac{0 - 12}{5} = -2.4\ \text{m s}^{-2}$, i.e. a deceleration of $2.4\ \text{m s}^{-2}$.
Gradient = acceleration.
▪ solved
Examiner's eye
Splitting into standard shapes is quicker and safer than the trapezium formula, and it makes a slip in one stage visible. You could also treat the whole thing as one trapezium: $\tfrac12(\text{sum of parallel sides})\times\text{height} = \tfrac12(15 + 6)(12) = 126$ m — the parallel sides being the total time at the bottom and the $6$ s at constant speed at the top. Same answer, and worth knowing as a check.
Worked example 2
Distance and displacement differ
A particle moves in a straight line. Its velocity is $6\ \text{m s}^{-1}$ for the first $5$ seconds, then $-4\ \text{m s}^{-1}$ for the next $3$ seconds. Find the displacement from the start and the total distance travelled.
MethodSigned area gives displacement; unsigned area gives distance
1
The graph is a rectangle of height $6$ above the axis from $t=0$ to $5$, then a rectangle of height $-4$ below the axis from $t=5$ to $8$.
Negative velocity is below the axis.
2
Area above: $5 \times 6 = 30$. Area below: $3 \times 4 = 12$, but it counts as $-12$ since the velocity is negative.
Sign follows the velocity.
3
Displacement is the signed total: $30 + (-12) = 18$ m.
The particle ends 18 m from the start.
4
Distance ignores direction, so add the magnitudes: $30 + 12 = 42$ m.
Total ground covered.
▪ solved
Why the two answers differ
The particle travels $30$ m forwards, then $12$ m back. It has covered $42$ m of ground, but ends up only $18$ m from where it started. Read the question carefully: "how far has it travelled" wants distance, "how far is it from its starting point" wants displacement. This is the same distinction as area under a curve dipping below the $x$-axis — signed versus geometric.
Worked example 3
Working backwards from a graph
A train travelling at $30\ \text{m s}^{-1}$ decelerates uniformly to rest, covering $450\ \text{m}$ while doing so. Use a velocity–time graph to find the time taken and the deceleration.
MethodThe area is known — use it to find the time
1
Sketch the graph: a straight line from $(0, 30)$ down to $(T, 0)$, where $T$ is the time to stop.
Uniform deceleration to rest.
2
The area beneath is a triangle, and it equals the distance: $\tfrac12 \times T \times 30 = 450$.
Area = displacement.
3
So $15T = 450$, giving $T = 30$ s.
Time taken.
4
The deceleration is the gradient: $\dfrac{0 - 30}{30} = -1\ \text{m s}^{-2}$, a deceleration of $1\ \text{m s}^{-2}$.
Gradient = acceleration.
▪ solved
Look deeper — the graph and the formulae are the same thing
You could answer this with SUVAT: $s = \tfrac12(u+v)t$ gives $450 = \tfrac12(30+0)t$, so $t = 30$. That is not a coincidence — $s = \tfrac12(u+v)t$ is the area of the trapezium under the v–t graph, which is where the formula came from. The graph is not an alternative method so much as a picture of the formula. Use whichever you find clearer, and use the other as a check.
Common mistake
Confusing the two graphs is the big one: a horizontal line means at rest on a displacement–time graph, but constant velocity on a velocity–time graph. They look identical and mean opposite things. The other trap is area below the axis — subtract it for displacement, add its magnitude for distance. And do not look for area under a displacement–time graph; it has no physical meaning.
Check yourself
A cyclist accelerates uniformly from rest to $8\ \text{m s}^{-1}$ in $4$ s, holds that speed for $10$ s, then decelerates uniformly to rest in $2$ s. Find the total distance travelled and the acceleration in the first stage. (Hint: sketch the v–t graph and split the area into a triangle, a rectangle and a triangle.)
Method
1
Stage 1 is a triangle: $\tfrac12 \times 4 \times 8 = 16$ m.
Accelerating from rest.
2
Stage 2 is a rectangle: $10 \times 8 = 80$ m.
Constant speed.
3
Stage 3 is a triangle: $\tfrac12 \times 2 \times 8 = 8$ m.
Decelerating to rest.
4
Total distance $= 16 + 80 + 8 = 104$ m. The acceleration in stage 1 is the gradient: $\dfrac{8-0}{4} = 2\ \text{m s}^{-2}$.
Sum, then gradient.
▪ solved
Check with the whole-trapezium method: $\tfrac12(16 + 10)(8) = 104$ m ✓ — the parallel sides being the total time $16$ s and the $10$ s spent at constant speed.