Pure Mathematics · Graphs & Transformations · Year 1
Cubic Graphs
A cubic's factorised form is a sketch waiting to happen — every root tells you exactly where the curve meets the x-axis, and whether it crosses through or just touches.
10 min read4 worked examples
The shape of a cubic
A cubic function has the form $y = ax^3+bx^2+cx+d$, with $a \neq 0$. Its overall shape is fixed entirely by the sign of $a$: if $a>0$, the curve rises from bottom-left to top-right; if $a<0$, it falls from top-left to bottom-right. Between those two ends, the curve can wiggle — rising, turning, falling, turning again — but the far-left and far-right behaviour never changes.
Why the sign of a controls the ends
For very large $|x|$, the $ax^3$ term completely dominates the other terms — $x^2$, $x$, and the constant become negligible by comparison. So a cubic behaves like $y=ax^3$ far from the origin: positive $a$ means large positive $x$ gives large positive $y$ (and large negative $x$ gives large negative $y$), and negative $a$ flips both ends. This is why only the leading coefficient's sign matters for the overall shape.
Reading roots from factorised form
When a cubic is written as a product of linear factors, each factor gives a root — a point where the curve meets the $x$-axis — and how the factor appears tells you exactly how the curve behaves there:
Single root $(x-p)$: the curve crosses the axis at $x=p$, passing from one side to the other. Repeated root $(x-p)^2$: the curve touches the axis at $x=p$ and turns back — the same behaviour as a repeated root of a quadratic. Triple root $(x-p)^3$: the curve crosses the axis at $x=p$, but flattens out as it does — an inflection through the axis rather than a clean crossing.
Strategy — sketching from factorised form
(1) Identify the sign of $a$ to fix the overall left-to-right direction. (2) Find the roots and their type (single, repeated, triple) to see where and how the curve meets the axis. (3) Find the $y$-intercept by substituting $x=0$. (4) Join the features smoothly, respecting the direction fixed in step 1 — you don't need calculus to get a good sketch, just the roots, the intercept, and the end behaviour.
Worked example 1
Sketching from three distinct roots
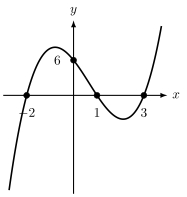
Sketch the graph of $y = (x-1)(x+2)(x-3)$, marking all axis intercepts.
$y=(x-1)(x+2)(x-3)$ — crossing at $-2,1,3$, with $y$-intercept $6$.
MethodRoots, y-intercept, then join respecting the end behaviour
1
The leading term, from multiplying the three $x$'s together, is $+x^3$, so $a>0$: bottom-left to top-right.
Positive leading coefficient.
2
Three single roots at $x=1,\,x=-2,\,x=3$ — the curve crosses the axis at each.
Order the roots on the axis: $-2, 1, 3$. Starting from bottom-left, the curve rises, crosses at $-2$, rises to a local max, falls, crosses at $1$, dips to a local min, then rises again, crossing at $3$ and continuing up.
Three crossings force exactly this rise-fall-rise pattern.
▪ sketched
Examiner's eye
A cubic with three distinct real roots always has exactly this "wiggle" shape — one local maximum and one local minimum between the outer roots. You don't need calculus to know a turning point exists between $-2$ and $1$, and another between $1$ and $3$; the crossings alone guarantee it.
Worked example 2
A repeated root · touching, not crossing
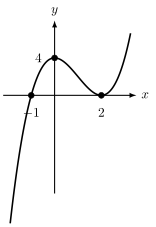
Sketch the graph of $y = (x-2)^2(x+1)$, marking all axis intercepts.
$y=(x-2)^2(x+1)$ — crosses at $-1$, touches at $2$, $y$-intercept $4$.
MethodIdentify the repeated root's touching behaviour
1
Leading term is $+x^3$ (positive), so bottom-left to top-right.
a > 0.
2
$x=2$ is a repeated root (power 2): the curve touches the axis here and turns back. $x=-1$ is a single root: the curve crosses here.
Different factor powers give different behaviour.
3
$y$-intercept: at $x=0$, $y=(-2)^2(1) = 4$.
Substitute x=0.
4
From bottom-left, the curve rises and crosses at $x=-1$, continues up to a local max, then descends to touch the axis at $x=2$ (without crossing), and rises away again.
Consistent with one crossing and one touch.
▪ sketched
The key insight
At a repeated root, the curve behaves locally like a parabola touching the axis — it doesn't pass through to the other side. This is identical to the repeated-root behaviour you've already seen for quadratics; a cubic with a squared factor is really "a quadratic touch, plus one more crossing" layered together.
Worked example 3
Factorising first, using the factor theorem
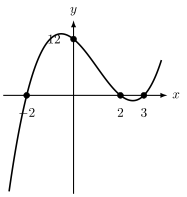
Given that $x=2$ is a root of $y = x^3 - 3x^2 - 4x + 12$, factorise fully and sketch the curve.
Not every cubic arrives pre-factorised — often you need the factor theorem first, exactly as in an earlier lesson, before any sketching can begin.
$y=(x-2)(x-3)(x+2)$ — crossing at $-2,2,3$, with $y$-intercept $12$.
MethodDivide out the known factor, factorise the remainder, then sketch
1
Since $x=2$ is a root, $(x-2)$ is a factor. Divide: $x^3-3x^2-4x+12 = (x-2)(x^2-x-6)$.
Polynomial division or inspection.
2
Factorise the quadratic: $x^2-x-6 = (x-3)(x+2)$.
Standard quadratic factorising.
3
Fully factorised: $y=(x-2)(x-3)(x+2)$ — three distinct roots at $x=2,3,-2$.
Combine both factorisations.
4
Leading coefficient is positive, $y$-intercept at $x=0$ is $(-2)(-3)(2)=12$ (matching the original constant term). Sketch: rise, cross at $-2$, local max, cross at $2$, local min, cross at $3$, rise.
Same sketching method as example 1, now with three roots in order -2, 2, 3.
▪ solved
Common mistake
Always check the $y$-intercept from the factorised form matches the constant term of the original expanded cubic — here both give $12$. If they disagree, a sign error has crept into the factorisation.
Worked example 4
Finding a cubic's equation from its graph · Challenge
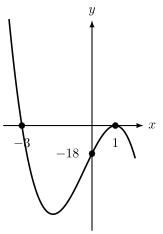
A cubic curve crosses the x-axis at $x=-3$, touches the x-axis at $x=1$, and passes through the point $(0, -18)$. Find the equation of the curve in the form $y=ax^3+bx^2+cx+d$.
The root behaviour (crossing vs touching) tells you the power of each factor directly; only the overall scaling constant $a$ remains unknown, found from the extra point given.
$y=-6(x+3)(x-1)^2$ — crosses at $-3$, touches at $1$, $y$-intercept $-18$; negative $a$ flips the ends.
MethodBuild the factorised form from the root behaviour, then find a
1
Crossing at $x=-3$ gives a single factor $(x+3)$. Touching at $x=1$ gives a repeated factor $(x-1)^2$.
Crossing = power 1, touching = power 2.
2
So $y = k(x+3)(x-1)^2$ for some constant $k$ (a cubic needs exactly a single plus a repeated root to reach degree 3).
Degrees check: 1 + 2 = 3.
3
Use the point $(0,-18)$: $-18 = k(3)(-1)^2 = k(3)(1) = 3k$.
Substitute x=0, y=-18.
4
Solve: $k=-6$.
Divide both sides by 3.
5
So $y = -6(x+3)(x-1)^2$. Expanding: $(x-1)^2=x^2-2x+1$, so $(x+3)(x^2-2x+1) = x^3+x^2-5x+3$, giving $y=-6x^3-6x^2+30x-18$.
Multiply out to reach the requested form.
▪ solved
Look deeper — negative k flips the whole picture
Since $k=-6$ is negative, the curve actually falls from top-left to bottom-right, the opposite of what the "positive-looking" factorised form might suggest at a glance. Always determine the sign of the overall scaling constant last, from the given point — never assume it's positive.
Common mistake
Confusing "touches" with "crosses" is the most frequent sketching error — a repeated (squared) factor always touches and turns back, never crosses through. Count the power of each factor carefully before drawing.
Check yourself
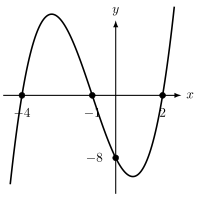
Sketch $y=(x+1)(x-2)(x+4)$, marking all intercepts, and state the shape of the curve at each root. (Hint: find the y-intercept, order the three roots, then apply the sign of the leading coefficient.)
Method
1
Roots at $x=-4,-1,2$, all single, so the curve crosses at each.
2
y-intercept: $x=0$ gives $y=(1)(-2)(4)=-8$.
3
Leading coefficient positive: rise from bottom-left, cross at $-4$, local max, cross at $-1$, local min, cross at $2$, rise to top-right.
Standard three-crossing wiggle.
▪ solved
$y=(x+1)(x-2)(x+4)$ — crossing at $-4,-1,2$, with $y$-intercept $-8$.