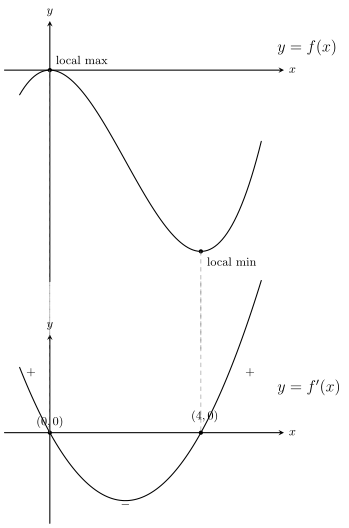
Given the graph of $y=f(x)$, the graph of $y=f'(x)$ isn't a mystery — every feature of one maps onto a feature of the other. This lesson is about reading that translation fluently, in both directions.
9 min read3 worked examples
From a function's graph to its gradient graph
$y=f'(x)$ is a graph in its own right — a new curve, plotted against the same $x$-axis, whose height at each point tells you the gradient of the original curve there. Three correspondences do almost all the work:
Stationary points of $f$ ↔ $x$-intercepts of $f'$. Wherever $f$ has a turning point (or any point with a horizontal tangent), $f'$ touches or crosses the $x$-axis there — nowhere else.
$f$ rising ($f'(x)>0$) ↔ $f'$ above the axis. Anywhere the original curve slopes upward, the gradient graph sits in positive territory.
$f$ falling ($f'(x)<0$) ↔ $f'$ below the axis. Anywhere the original curve slopes downward, the gradient graph dips negative.
A steeper section of $f$ corresponds to a section of $f'$ that sits further from the axis (a larger $|f'(x)|$); a section of $f$ that's nearly flat but not stationary corresponds to $f'$ sitting close to, but not touching, the axis.
Every stationary point on f becomes an x-intercept on f′ — and the sign of f′ in between tells you whether f was rising or falling on that stretch.
A step-by-step method for sketching f′ from f
Strategy — transferring a sketch
(1) Locate every stationary point of $f$ and mark those same $x$-values as points where $f'(x)=0$ on the new axes. (2) For each interval between consecutive stationary points (and beyond the outermost ones), decide whether $f$ was increasing or decreasing there. (3) Draw $f'$ crossing the axis at each marked value, positive on "increasing" intervals and negative on "decreasing" intervals. (4) Use relative steepness of $f$ to judge how far $f'$ should sit from the axis — steeper sections of $f$ give taller peaks or deeper dips in $f'$.
The reverse process — sketching $f$ from a description or graph of $f'$ — uses exactly the same correspondences read backwards: an $x$-intercept of $f'$ tells you where to put a stationary point on $f$, and the sign of $f'$ either side tells you whether that stationary point is a maximum, a minimum, or neither.
Worked example 1
Sketch f′(x) from a description · interpreting a curve
A curve $y=f(x)$ has a local minimum at $x=1$ and a local maximum at $x=4$. It decreases (steeply at first, then more gently) for $x<1$, increases across $1<x<4$, and decreases again for $x>4$. Sketch $y=f'(x)$.
MethodMark the intercepts, then fill in the sign on each interval
1
The stationary points at $x=1$ and $x=4$ become $x$-intercepts of $f'$: the curve $y=f'(x)$ passes through $(1,0)$ and $(4,0)$, and nowhere else on the axis.
Stationary points of f ↔ zeros of f′.
2
For $x<1$, $f$ is decreasing, so $f'(x)<0$ there — the graph of $f'$ lies below the axis, starting a long way down (steep decrease) and rising toward zero as it approaches $x=1$ (the decrease becomes gentler).
Falling f ↔ negative f′; steepness ↔ distance from axis.
3
For $1<x<4$, $f$ is increasing, so $f'(x)>0$ — the graph of $f'$ lies entirely above the axis between $x=1$ and $x=4$.
Rising f ↔ positive f′.
4
For $x>4$, $f$ is decreasing again, so $f'(x)<0$ — the graph of $f'$ drops below the axis once more.
Falling f ↔ negative f′.
5
Overall shape: $f'$ starts negative, crosses zero at $x=1$ going upward, stays positive until it crosses zero at $x=4$ going downward, then stays negative — a curve shaped like a hump sitting between two negative "tails".
The full sketch, built entirely from the sign pattern.
▪ solved
Examiner's eye
No formula for $f$ was given anywhere in this question — the entire sketch of $f'$ comes from reading the words "decreasing", "increasing", "local minimum" and "local maximum" and converting each one directly into a feature of $f'$'s graph. This is the pure interpretation skill the topic is testing.
Worked example 2
Sketch f′(x) from an algebraic function · confirming with calculus
The curve $y=f(x)=x^2(x-6)$ has stationary points at $x=0$ and $x=4$. Sketch $y=f'(x)$, showing the coordinates of any points where it meets the axes.
MethodDifferentiate to confirm the sign pattern, then sketch
1
Expand: $f(x) = x^3-6x^2$, so $f'(x) = 3x^2-12x = 3x(x-4)$.
Power rule after expanding.
2
$f'(x)=0$ at $x=0$ and $x=4$ — confirming the given stationary points, and giving the $x$-intercepts of $y=f'(x)$ directly: $(0,0)$ and $(4,0)$.
Factorised form reveals the roots at once.
3
$f'(x)=3x(x-4)$ is an upward-opening parabola (positive coefficient of $x^2$), so it is positive outside its roots and negative between them: $f'(x)>0$ for $x<0$, $f'(x)<0$ for $0<x<4$, $f'(x)>0$ for $x>4$.
Standard quadratic sign pattern.
4
This matches $f$ itself: $f$ rises to a local maximum at $x=0$, falls to a local minimum at $x=4$, then rises again — exactly the increasing/decreasing pattern the signs of $f'$ describe.
Cross-checks the two graphs against each other.
5
Sketch: a $\cup$-shaped parabola through $(0,0)$ and $(4,0)$, dipping below the axis between them, with minimum turning point at $x=2$ (the midpoint of the roots, since $f'$ is quadratic).
Symmetry of a parabola's vertex.
▪ solved
Why this works so cleanly here
Because $f$ is a cubic, $f'$ is always a quadratic — so its graph is always a parabola, and its vertex always sits exactly halfway between its two roots (here, at $x=2$). That symmetry doesn't appear in the general case (if $f$ isn't a cubic, $f'$ needn't be a parabola at all), but it's a useful shortcut whenever it applies.
Worked example 3
Sketch f(x) from f′(x) · Challenge, reverse direction
The gradient function of a curve $y=f(x)$ satisfies: $f'(x)<0$ for $x<-2$, $f'(-2)=0$, $f'(x)>0$ for $-2<x<3$, $f'(3)=0$, and $f'(x)<0$ for $x>3$. Describe the shape of $y=f(x)$, stating the nature of each stationary point.
MethodRead the correspondences in reverse
1
$f'(-2)=0$ and $f'(3)=0$ mean $f$ has stationary points at $x=-2$ and $x=3$, and nowhere else.
Zeros of f′ ↔ stationary points of f.
2
For $x<-2$, $f'(x)<0$, so $f$ is decreasing. For $-2<x<3$, $f'(x)>0$, so $f$ is increasing. The gradient changes from negative to positive at $x=-2$, so this stationary point is a local minimum.
Falling then rising ↔ minimum.
3
For $-2<x<3$, $f'(x)>0$ (increasing), and for $x>3$, $f'(x)<0$ (decreasing). The gradient changes from positive to negative at $x=3$, so this stationary point is a local maximum.
Rising then falling ↔ maximum.
4
Overall shape: $f$ decreases until $x=-2$, reaches a local minimum, increases until $x=3$, reaches a local maximum, then decreases again beyond $x=3$ — the shape of a cubic with a negative leading coefficient, reversed left-to-right compared with the usual "up first" cubic.
The complete qualitative sketch.
▪ solved
Look deeper — no formula needed
This question never gives an equation for $f$ or $f'$ — only a sign description. Every conclusion (where the stationary points are, and whether each is a maximum or minimum) follows purely from tracking the sign of $f'$ across the three intervals, exactly as the first-derivative test does when it's used the usual way round.
Common mistake
Don't draw $f'$ touching the axis at points where $f$ is merely small or nearly flat — $f'$ only meets the axis exactly at $f$'s stationary points. And don't confuse the height of $f$ with the height of $f'$: a curve $f$ can be very high up (or very low down) while sloping only gently, giving a small value of $f'$, and vice versa. The two graphs describe different things and are read independently, even though they're linked interval by interval.
Check yourself
The curve $y=f(x)=x^3-3x$ has stationary points at $x=-1$ and $x=1$. Sketch $y=f'(x)$, giving the coordinates of any points where it crosses the axes and stating the sign of $f'(x)$ on each interval. (Hint: find $f'(x)$, factorise it, and use the sign of the leading coefficient to decide the parabola's shape.)
Method
1
$f'(x) = 3x^2-3 = 3(x-1)(x+1)$, so $f'$ crosses the axis at $(-1,0)$ and $(1,0)$.
Difference of two squares.
2
Positive leading coefficient (3), so the parabola opens upward: $f'(x)>0$ for $x<-1$, $f'(x)<0$ for $-1<x<1$, $f'(x)>0$ for $x>1$.
Standard sign pattern outside/inside the roots.
3
The vertex sits at $x=0$ (midpoint of the roots), where $f'(0)=-3$ — the lowest point of the parabola.
Symmetry of a quadratic between its roots.
▪ solved
This matches $f$ itself: rising to a local maximum at $x=-1$, falling to a local minimum at $x=1$, exactly as the sign of $f'$ describes.