Atomic Line Spectra
Heat a gas until it glows and split the light it gives off through a prism or grating. Instead of a smooth rainbow, you get sharp, separated lines at exact colours, with darkness everywhere else. That pattern is a direct fingerprint of the energy levels inside the atoms doing the glowing.
Line spectra versus continuous spectra
A hot solid, like an incandescent bulb's filament, emits a continuous spectrum — light of every wavelength, blending smoothly with no gaps. A hot, low-pressure gas behaves completely differently: pass its light through a diffraction grating or prism and you see a line spectrum, a small number of narrow, bright, sharply defined lines with nothing between them. Atomic hydrogen is the standard example, producing its own distinctive, repeatable set of lines.
This difference is direct evidence about what's happening inside the atoms. A continuous spectrum would result if an atom's electrons could have any energy at all, since transitions between a continuous range of energies release photons of any wavelength. A line spectrum only makes sense if electrons are restricted to a small set of specific, discrete energy values — quantised energy levels — allowing only a limited, specific set of energy gaps, and so a limited set of photon wavelengths.
There's a mirror-image version called an absorption spectrum. If light with a continuous range of wavelengths passes through a cool, low-pressure gas, the gas absorbs photons at exactly the wavelengths matching one of its own energy-level gaps; every other wavelength passes through unaffected. The result is a continuous background with narrow dark lines missing — and those missing wavelengths line up exactly with the bright emission lines the same gas would produce if made to glow. Both spectra are two views of the same energy-level gaps: emission lines show photons released as electrons drop down; absorption lines show the identical photon energies removed as electrons are excited up between the same levels.
Where the lines come from
An electron in an atom can only occupy one discrete energy level at a time. When it drops from a higher level to a lower one, the atom loses energy equal to the gap, emitted as a single photon. Since a photon's energy is fixed by the size of the gap, and its energy sets its frequency, each specific transition produces light of one specific, fixed frequency — one line in the spectrum.
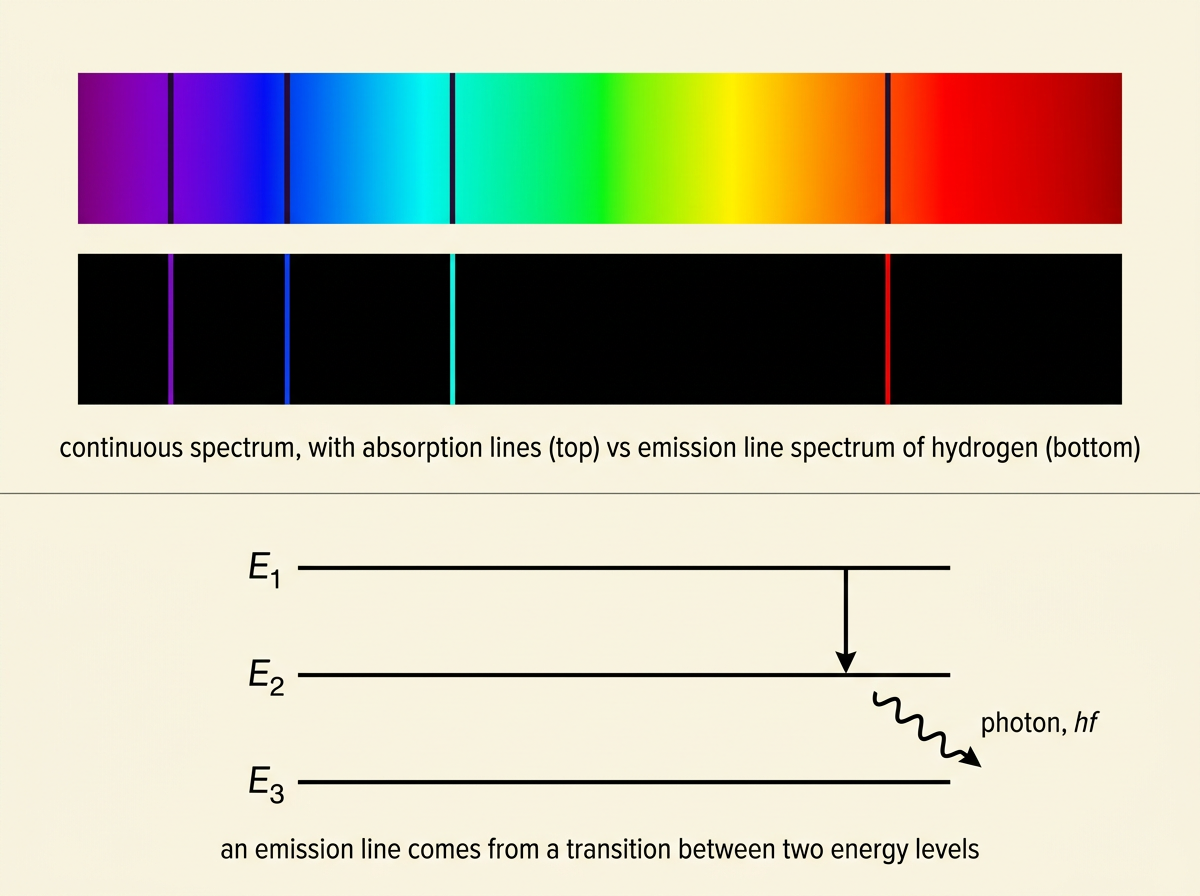
Because a given atom has a fixed set of energy levels, it has a fixed set of possible gaps — and so a fixed set of photon frequencies it can ever emit. That's why every atomic hydrogen source produces exactly the same spectral lines: the underlying energy levels are always the same.
Energy levels are sometimes quoted in joules and sometimes electronvolts (eV), and exam questions often mix the two. Since $hf = E_1 - E_2$ needs the energy difference in joules to be consistent with $h$ in $\text{J s}$, always convert eV to joules first using $1\ \text{eV} = 1.60\times10^{-19}\ \text{J}$.
Observing spectra with a diffraction grating
The line spectrum from a gas discharge tube is observed in practice using a diffraction grating. Passing light through the grating produces sharp bright maxima for each wavelength present, at angles given by $d\sin\theta = n\lambda$. Since each spectral line is essentially a single precise wavelength, each produces its own separate maxima — measuring those angles for a given order $n$ gives the wavelength of each line directly.
Energy level diagrams
Atomic energy levels are drawn as horizontal lines on a vertical energy axis. Levels are conventionally negative, because an electron bound to the nucleus has less energy than a free electron at rest (defined as zero) — pulling an electron further from the nucleus always moves its energy closer to zero from below. The lowest, most negative level is the ground state: the level an electron occupies by default and falls back to if undisturbed. Levels above, still negative but less so, are excited states, labelled $n=2, 3, 4\ldots$ with the ground state as $n=1$.
At the top, $E=0$ marks the ionisation level: an electron that has just escaped the atom's pull entirely, with no kinetic energy left over. An electron needs at least enough energy to reach $E=0$ to leave the atom altogether — anything less, and it can only jump to another bound level. Excitation is a transition between two negative levels; ionisation reaches or exceeds $E=0$.
Because levels are negative, "higher energy" means less negative, not larger in magnitude — a level at $-1.51\,\text{eV}$ is higher than one at $-3.40\,\text{eV}$, even though $3.40 > 1.51$. A transition down (to a more negative level) releases a photon; a transition up requires one. This sign convention trips up a lot of otherwise-correct working.
How the atoms get excited in the first place
None of this emission happens spontaneously in an undisturbed gas — left alone, every electron sits in its ground state. Something has to put energy in first, lifting electrons into excited states (or knocking them out) before they drop back and emit. In a gas discharge tube, that something is collisions with free electrons.
A discharge tube contains a low-pressure gas with a large potential difference applied across it. This pd accelerates free electrons to high speeds; as they career through the gas, they collide with atoms, and if a colliding electron carries enough kinetic energy, the collision can excite a bound electron to a higher level.
What happens in a given collision depends on the incoming electron's kinetic energy compared with the atom's level gaps:
- If less than the gap to the next level, no transition occurs — the collision is elastic.
- If at least equal to a level gap, the atom is excited: a bound electron jumps up, absorbing that energy from the colliding electron.
- If at least equal to the ionisation energy, the atom can be ionised outright instead.
Once excited, an electron falls back down within a very short time, emitting a photon as it does. This is the mechanism that populates the excited states responsible for every line in an observed emission spectrum — without continuous collisional excitation, the discharge tube would stop glowing.
Key takeaways
- A continuous spectrum contains light of every wavelength; a line spectrum contains only sharp, discrete lines at specific wavelengths.
- A line spectrum is direct evidence that the energy levels available to electrons within an atom are discrete (quantised), not continuous — only a discrete set of levels can produce a discrete set of allowed energy gaps.
- An absorption spectrum is the mirror image of an emission spectrum: dark lines missing from a continuous background, at the same wavelengths as the gas's emission lines, where photons matching an energy-level gap have been absorbed.
- A photon is emitted when an electron drops from a higher energy level to a lower one, with the photon's energy fixed by the size of the gap: $hf = E_1 - E_2$. E.g. a transition from $-1.51\,\text{eV}$ to $-3.40\,\text{eV}$ emits a photon of wavelength $658\,\text{nm}$.
- Energy levels may be quoted in joules or electronvolts — always convert to joules before combining with $h$ in SI units.
- Energy-level diagrams use negative energies, with the ground state as the most negative level and $E=0$ as the ionisation level; "higher energy" means less negative, not larger in magnitude.
- A diffraction grating, using $d\sin\theta = n\lambda$, is the practical tool for measuring the individual wavelengths present in a line spectrum.
- In a discharge tube, free electrons accelerated by the applied pd collide with gas atoms, causing excitation (if their kinetic energy matches a level gap) or ionisation (if it reaches the ionisation energy) — this collisional process is what populates the excited states responsible for the emission lines observed.
That's the full arc of AS Physics on this site: from the basic language of quantities and measurement, through mechanics and circuits, to waves, and finally to the quantum behaviour of light and matter that closes this topic. Every idea from here traces back to those first definitions of a physical quantity and its unit.