A few plotted points, a Cartesian equation when one is available, and a check for symmetry — together they're usually enough to sketch a parametric curve with confidence.
8 min read2 worked examples
Combining table of values, elimination and symmetry
Every parametric curve can be sketched from a table of values alone, but two extra checks make the sketch far more reliable: eliminating $t$ to see whether the Cartesian shape is one you already recognise, and checking for symmetry using the parity of $x(t)$ and $y(t)$ in $t$.
Using symmetry as a sketching aid
If replacing $t$ with $-t$ leaves $x(t)$ unchanged but flips the sign of $y(t)$ (i.e. $x$ is even in $t$ and $y$ is odd in $t$), then every point $(x,y)$ on the curve is matched by a point $(x,-y)$ — the curve is symmetric about the x-axis. The same idea works the other way round for symmetry about the $y$-axis. Spotting this before plotting halves the work: sketch $t\ge0$, then reflect.
When direct substitution isn't straightforward — for example, if $t$ appears squared in one equation, so the same $x$-value could come from two different $t$-values — elimination can still describe the overall shape, provided the resulting equation is read alongside the original domain rather than in place of it.
Worked example 1
A curve where x is even and y is odd in t
A curve has parametric equations $x=t^2$, $y=t^3$ for $t\in\mathbb{R}$. Generate a table of values for $t=-2,-1,0,1,2$, identify any symmetry, and sketch the curve.
MethodPlot a table of values, then check the parity of x(t) and y(t)
$x(t)=t^2$ is unchanged under $t\to-t$ (even), while $y(t)=t^3$ flips sign under $t\to-t$ (odd).
Check parity: replacing t with −t and comparing to the original.
3
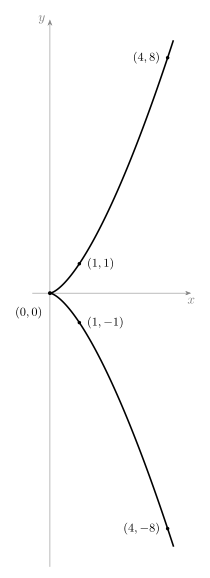
So the curve is symmetric about the $x$-axis — the points for $t=-2,-1$ are exactly the reflections of $t=2,1$.
This matches the symmetry rule: x even, y odd ⇒ symmetric about the x-axis.
4
Since $x=t^2\ge0$ always, the entire curve lies in $x\ge0$. Both branches meet only at the origin, where $t=0$.
x can never be negative, so nothing is plotted to the left of the y-axis.
5
Plotting the five points and joining them in order of increasing $t$ gives two mirror-image branches meeting at a sharp point at the origin — the upper branch for $t>0$, the lower for $t<0$.
Joining in t-order, using the symmetry to check the lower branch mirrors the upper.
▪ solved
Look deeper
Eliminating $t$ here needs care: $y^2=t^6=(t^2)^3=x^3$, so $y^2=x^3$. This single Cartesian equation captures both branches at once (since squaring $y$ loses the sign), which is exactly why the parity/symmetry check above is more informative for sketching than elimination alone. A curve shaped like this — two branches meeting at a point — is sometimes called a cusp.
The two branches meet at a sharp cusp at the origin rather than a smooth turning point — a shape a table of values reveals far more clearly than elimination alone.
Worked example 2
Sketching only part of a recognisable curve · Challenge
A curve has parametric equations $x=t+2$, $y=t^2$ for $t\ge0$. Find its Cartesian equation, and sketch the part of the curve this domain describes.
MethodEliminate t to recognise the full shape, then use the domain to select the correct piece
1
From $x=t+2$: $t=x-2$.
Rearrange the linear equation for t.
2
Substitute into $y=t^2$: $y=(x-2)^2$.
Replace t with x − 2.
3
This is a parabola with vertex at $(2,0)$, the same recognisable shape as $y=x^2$ shifted 2 units right.
Recognise the vertex form of a parabola.
4
Since $t\ge0$, the smallest value of $x=t+2$ occurs at $t=0$, giving $x=2$ — exactly the vertex. As $t$ increases, $x$ increases without bound.
Translate the restriction on t into a restriction on x.
5
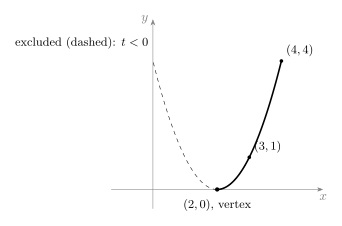
So the curve is only the right-hand half of the parabola, $y=(x-2)^2$ for $x\ge2$ — starting exactly at the vertex and rising to the right.
The domain restriction happens to cut the parabola precisely at its vertex, leaving only one branch.
▪ solved
Examiner's eye
Table of values at $t=0,1,2$ gives $(2,0)$, $(3,1)$, $(4,4)$ — plotting these confirms the sketch independently of the algebra. Whenever a restriction on $t$ happens to land exactly on a turning point of the eliminated curve, only one branch survives; a slightly different restriction (say $t\ge-1$) could instead have kept both sides.
Since $t\ge0$ places the vertex exactly at the boundary of the restriction, only the right-hand branch of the full parabola survives — the dashed left branch is never reached.
Common mistake
Assuming a parametric curve must look like a full, familiar Cartesian shape without checking the domain of $t$ — a squared term like $x=t^2$ can never be negative, so half of an apparently symmetric picture may simply not exist. Always cross-check a handful of plotted points against whatever Cartesian equation (or symmetry argument) elimination produces.
Check yourself
A curve has parametric equations $x=1-t^2$, $y=2t$ for $t\in\mathbb{R}$. Generate a table of values for $t=-2,-1,0,1,2$, identify any symmetry, and state the Cartesian equation. (Hint: check whether x(t) is even or odd, and whether y(t) is even or odd, before plotting.)