Stress–Strain Graphs
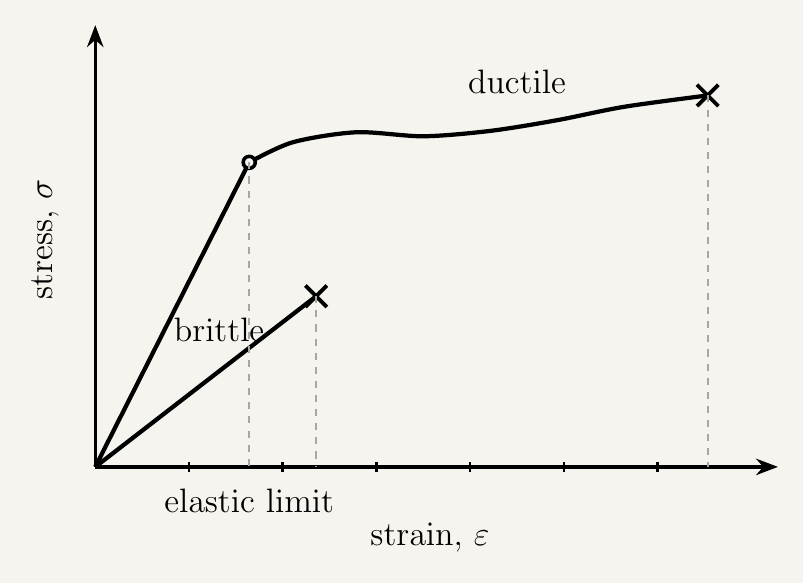
If you had to keep just one diagram from this entire topic, it would be this one. A full stress-strain graph for a ductile metal packs the Young modulus, the elastic limit, the yield point, the ultimate tensile stress, and the fracture point all onto a single curve — reading it properly is the single most valuable skill this module builds.
Reading the full curve, feature by feature
Consider a tensile test (covered in full in the next lesson) on a specimen of a ductile material such as mild steel, stretched steadily until it finally fractures, with stress plotted against strain throughout. Reading the resulting graph from left to right, in order of increasing stress, reveals a sequence of distinct regions.
1. The elastic region
At low stress, the graph is a straight line through the origin. The gradient of this line is the Young modulus, $E = \sigma/\varepsilon$, as covered earlier in this topic. Any point on this straight section corresponds to fully recoverable, elastic deformation.
2. The limit of proportionality and the yield point
The straight line eventually curves away from linearity at the limit of proportionality — beyond this point, stress and strain are no longer directly proportional. This point occurs at, or very close to, the material's elastic limit. Shortly after, the material reaches its yield point, where plastic deformation begins in earnest. In some materials, particularly certain steels, the yield point shows up as a distinctive dip or a brief flat plateau on the graph, where the material extends noticeably for little or no increase in stress, before the curve resumes rising.
3. Plastic deformation and strain hardening
Beyond the yield point, the material is deforming plastically — this deformation is now permanent, as covered in the previous lesson. Interestingly, the stress needed to continue extending the material initially keeps rising through this region, a phenomenon called strain hardening (or work hardening): as the material's internal crystal structure rearranges through slip, it typically becomes more resistant to further slip, so progressively more stress is required to continue deforming it.
4. Ultimate tensile stress (UTS)
Strain hardening continues until the graph reaches its peak — the ultimate tensile stress (UTS), the maximum stress the material can sustain during the test. This is a key design and material-comparison figure, often quoted alongside the Young modulus and yield stress in material data tables.
5. Necking and fracture
Beyond the UTS, the specimen begins to neck: deformation concentrates at one particular location along its length, which visibly thins. Because the plotted stress is calculated using the specimen's original cross-sectional area (not the reduced area at the neck), the graph shows stress apparently falling even as the material continues to deform, right up until the specimen finally separates at the breaking point.
A brief preview: brittle materials look very different
Not every material's stress-strain graph shows this rich sequence of features. A brittle material's graph is close to a straight line almost all the way to fracture, with little or no visible yield point, strain hardening, or necking region — the material simply snaps shortly after (or even at) the end of its elastic region, as shown by the brittle curve in the figure above. The next two lessons build directly on this contrast: first by treating the tensile test itself as a proper experimental procedure, then by exploring the ductile/brittle distinction in full.
Key takeaways
- A stress-strain graph for a ductile material shows, in order: a linear elastic region, a limit of proportionality, a yield point, plastic deformation with strain hardening, the ultimate tensile stress (UTS), necking, and finally fracture.
- The gradient of the initial straight-line region gives the Young modulus.
- The yield point marks the onset of plastic (permanent) deformation, sometimes visible as a dip or plateau.
- Strain hardening is the rise in stress needed to continue plastic deformation, as the material's internal structure resists further slip.
- The ultimate tensile stress (UTS) is the peak stress the material sustains; beyond it, necking causes the plotted stress to fall even as the material keeps stretching, until it fractures.
- Elastic strain energy up to any point on the linear region is the triangular area beneath the curve.
- A brittle material's graph looks very different: close to a straight line almost to fracture, with little or no plastic region — covered fully in the "Ductile and Brittle Materials" lesson.