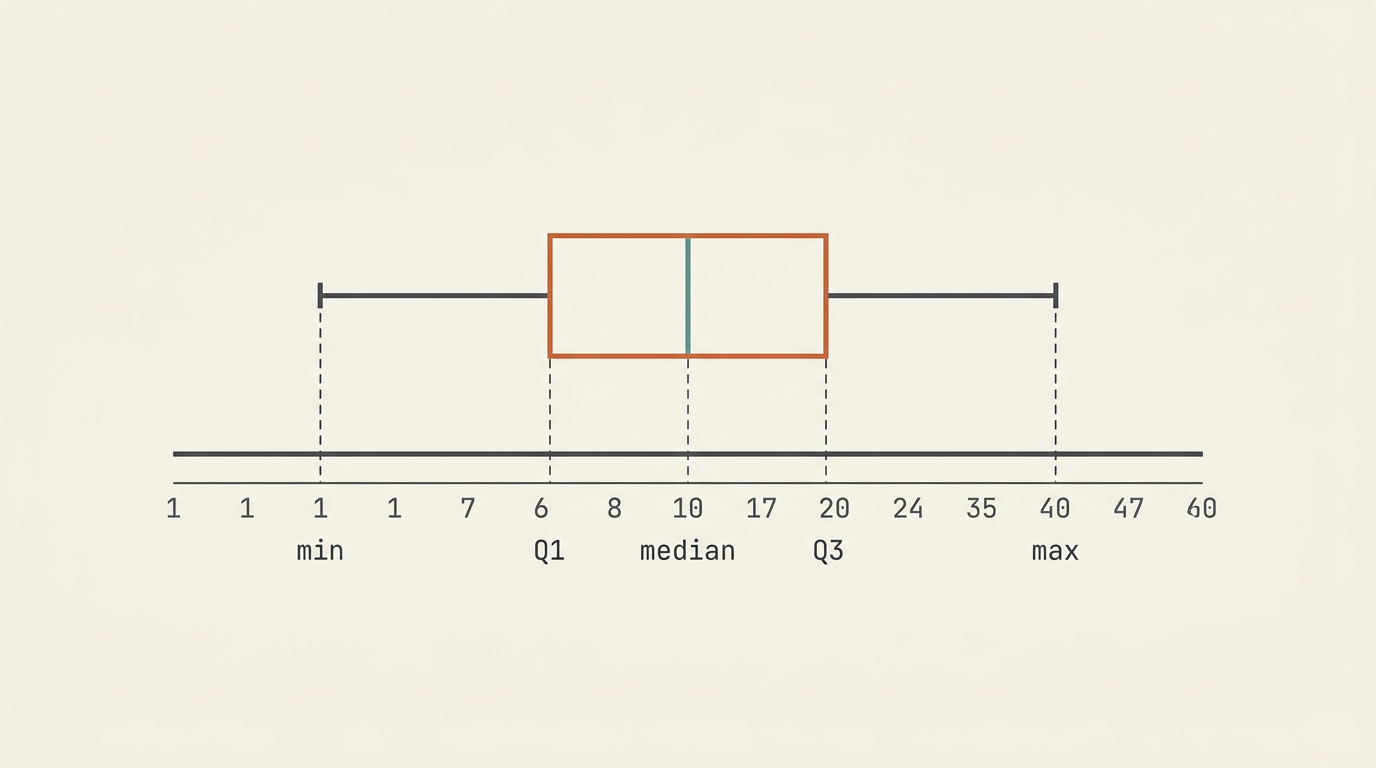
Five numbers, drawn as one picture, show a dataset's centre, spread and skew at a glance.
9 min read4 worked examples
The five-number summary
A box plot is built from five values: the minimum, the lower quartile $Q_1$, the median, the upper quartile $Q_3$, and the maximum. A box runs from $Q_1$ to $Q_3$ (with a line at the median), and "whiskers" extend out to the minimum and maximum — unless an outlier test removes one or both ends.
The anatomy of a box plot: whisker – box – median line – box – whisker, built from the five-number summary.
Always label your box plot
Use a clear, labelled scale on the axis, and give the diagram a title stating what it represents. An unlabelled box plot — however accurately drawn — rarely earns full marks.
Drawing a box plot with an outlier
When one or both extreme values fail an outlier test (see the previous lesson), the whisker is drawn only as far as the most extreme value that is not an outlier. Each outlier is then marked separately, usually with a cross or a dot, beyond the end of the shortened whisker.
Reading skew from a box plot
The relative lengths of the two halves of a box plot reveal skew. If the median sits closer to $Q_1$ (so the box's upper half is longer) and the upper whisker is also longer, the data is positively skewed — a longer tail toward high values. If the median sits closer to $Q_3$ and the lower whisker is longer, the data is negatively skewed. Roughly equal halves suggest a fairly symmetric distribution.
Compare corresponding pieces, not just "does it look lopsided"
Judge skew by comparing box-half against box-half and whisker against whisker with actual numbers, rather than eyeballing the whole shape. A mark scheme expects a numerical justification, not just "the picture looks skewed."
Worked example 1
Constructing a box plot
A dataset has minimum $8$, $Q_1=15$, median $21$, $Q_3=27$, maximum $40$. Sketch the box plot, and comment briefly on the skew.
MethodPlot all five values, then compare the two halves
1
Whisker from $8$ to $15$ ($Q_1$); box from $15$ to $27$ ($Q_3$) with a line at $21$ (median); whisker from $27$ to $40$.
The box itself is symmetric, but the upper whisker is almost twice as long as the lower whisker, so the data shows mild positive skew driven by the tail of larger values.
Whisker lengths reveal the tail direction.
▪ sketched
Worked example 2
Drawing a box plot with an outlier
A dataset has minimum $3$, $Q_1=12$, median $17$, $Q_3=22$, maximum $52$. Using $k=1.5$, show that $52$ is an outlier, and describe how the box plot should be drawn.
MethodTest the maximum, then adjust the whisker
1
$\text{IQR}=22-12=10$, so $1.5\times10=15$.
Standard IQR-method calculation.
2
Upper boundary: $Q_3+15=22+15=37$.
Only the upper end needs checking, since the maximum is the value in question.
3
Since $52>37$, the maximum is an outlier.
Compare against the boundary.
4
The upper whisker should stop at the largest non-outlier value (not $52$ itself), and $52$ should be marked separately, typically with a cross.
Outliers are shown individually, not absorbed into the whisker.
▪ shown
Common mistake
Without further data, you can't state exactly where the adjusted whisker ends — only that it stops at the largest value below the outlier boundary, which requires knowing more of the dataset than the five-number summary alone provides. Don't assume the whisker simply stops at the boundary value itself unless that value is actually present in the data.
Worked example 3
Reading skew from a five-number summary
A dataset has minimum $5$, $Q_1=9$, median $11$, $Q_3=20$, maximum $24$. Describe the skew of the distribution.
MethodCompare the box halves, then check the whiskers agree
1
Box halves: lower $11-9=2$, upper $20-11=9$ — the upper half is far longer.
Compares median's position within the box.
2
Whiskers: lower $9-5=4$, upper $24-20=4$ — equal.
Whiskers alone don't show skew here.
3
Since the median sits much closer to $Q_1$ than to $Q_3$, the distribution is positively skewed — the equal whisker lengths don't override what the box itself shows.
The box's shape is the primary evidence for skew.
▪ described
Look deeper
Skew isn't decided by the whiskers alone. Here the whiskers are equal, but the box is clearly lopsided — and it's the median's position relative to $Q_1$ and $Q_3$ that gives the more reliable signal of skew, since it reflects where the bulk of the middle 50% of the data actually sits.
Worked example 4
Interpreting an unusual box plot · Challenge
A dataset has minimum $2$, $Q_1=6$, median $=Q_3=14$, maximum $18$. Explain what it means for the median and upper quartile to be equal.
MethodThink about what "zero width" in the upper box-half implies
1
Normally the upper half of the box, from the median to $Q_3$, has some positive width.
The usual case, for comparison.
2
Here that width is $Q_3-\text{median}=14-14=0$.
Zero width means no gap between median and Q₃.
3
Since the median is the $50$th percentile and $Q_3$ is the $75$th percentile, this means a large block of consecutive data values — everywhere between the $50$th and $75$th percentile positions — must all equal $14$.
Zero spread over that range forces repeated values.
4
In other words, at least a quarter of the dataset takes the exact value $14$ — a "plateau" of repeated readings, rather than a smoothly spread-out set of values.
Interprets the algebra in terms of the data.
▪ explained
Look deeper
A box plot can hide this kind of detail — two box plots with identical five-number summaries can come from very differently shaped datasets. A box of zero width like this is a useful clue that the underlying data has repeated or rounded values clustering at one point, something a box plot alone can't fully reveal.
Common mistake
Don't test the median or the quartiles themselves for being outliers — the test only ever applies to the minimum and maximum (or any raw values beyond them), since $Q_1$ and $Q_3$ are used to build the outlier boundaries and can never fall outside them.
Check yourself
A dataset has minimum $30$, $Q_1=40$, median $58$, $Q_3=62$, maximum $70$. Compare the two box halves and state the skew. (Hint: find median − Q₁ and Q₃ − median.)