Set a third variable loose to drive both x and y at once, and a curve traces itself out as it runs.
7 min read2 worked examples
Describing a curve with a parameter
So far, curves have been described by a single Cartesian equation connecting $x$ and $y$ directly, such as $y=x^2$. A parametric description instead gives both $x$ and $y$ separately in terms of a third variable, the parameter $t$:
$x = f(t), \qquad y = g(t)$
As $t$ varies, the point $(f(t), g(t))$ traces out a path in the plane — this path is the curve. Parametric equations are especially natural for describing motion, where $t$ often represents time, and for curves (like circles) that aren't the graph of a single function $y=f(x)$.
Not every parametric curve involves trigonometric functions. For instance, $x=5t$, $y=\dfrac{5}{t}$ (for $t\ne0$) traces the curve $xy=25$, since $xy = 5t \cdot \dfrac{5}{t} = 25$ for every value of $t$ — a hyperbola, not a circle. (Curves built from $\sin t$ and $\cos t$, like circles, get a lesson of their own next.)
Plotting a parametric curve, and the role of the domain
To sketch a parametric curve by hand, choose several values of $t$, compute the corresponding $(x,y)$ pair for each, plot the points, and join them in the order $t$ increases.
The domain of the parameter — the set of $t$-values allowed — is just as important as the equations themselves, because restricting it produces only part of the full curve, as the second worked example below shows.
Worked example 1
Generating a table of values and sketching
A curve has parametric equations $x=t^2$, $y=2t$ for $-2\le t\le2$. Generate a table of values for $t=-2,-1,0,1,2$ and sketch the curve.
MethodSubstitute each t-value into both equations, then plot and join in order
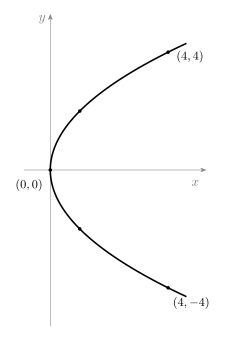
Plotting $(4,-4), (1,-2), (0,0), (1,2), (4,4)$ and joining them in order of increasing $t$ traces a sideways parabola, opening to the right, with vertex at the origin.
Joining points in t-order (not x-order) gives the correct shape and direction of travel.
▪ solved
Look deeper
Since $y=2t \Rightarrow t=\dfrac{y}{2}$, substituting into $x=t^2$ gives $x=\dfrac{y^2}{4}$, i.e. $y^2=4x$ — confirming this is indeed a sideways parabola. Converting to Cartesian form like this is a powerful check on a parametric sketch.
Plotting the five table-of-values points and joining them in order of increasing $t$ traces the sideways parabola $y^2=4x$.
Worked example 2
Identifying a curve and its domain from a described path · Challenge
A curve has parametric equations $x=5t$, $y=\dfrac{5}{t}$ for $t>0$. Show the curve satisfies $xy=25$, sketch it, and explain why the restriction $t>0$ means only part of the full curve $xy=25$ is shown.
MethodEliminate t algebraically, then examine which branch the restricted domain selects
1
$xy = (5t)\left(\dfrac5t\right) = 25$ for every $t\ne0$, so every point on the curve satisfies $xy=25$.
Direct substitution eliminates t entirely.
2
The full Cartesian curve $xy=25$ (i.e. $y=\dfrac{25}{x}$) has two branches: one in the first quadrant ($x>0,y>0$) and one in the third quadrant ($x<0,y<0$).
A reciprocal-type curve xy = constant > 0 always has two symmetric branches.
3
For $t>0$: $x=5t>0$ and $y=\dfrac5t>0$, so every point has both coordinates positive.
Check the sign of x and y under the given restriction on t.
4
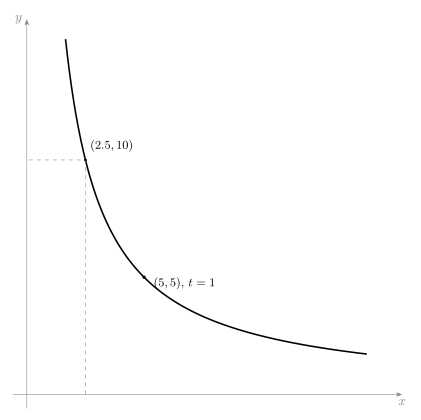
So the parametric curve with $t>0$ traces only the first-quadrant branch of $xy=25$; the third-quadrant branch (which would need $t<0$) is entirely excluded.
The restricted domain of t directly determines which branch of the full Cartesian curve is produced.
5
As $t\to0^+$, $x\to0^+$ and $y\to+\infty$; as $t\to\infty$, $x\to\infty$ and $y\to0^+$ — so the curve approaches both axes asymptotically without ever touching them.
Describes the full shape and behaviour of the traced branch.
▪ solved
Look deeper
This illustrates the general principle from this lesson at its sharpest: eliminating $t$ gives the full Cartesian relationship ($xy=25$), but only the parametric equations together with their domain tell you exactly which piece of that relationship is actually the curve. Two different domains of $t$ can produce two completely different-looking arcs from the very same Cartesian equation.
The traced branch of $xy=25$ hugs both positive axes ever more closely but never touches them — the third-quadrant branch, needing $t<0$, plays no part here.
Common mistake
Sketching the full Cartesian shape implied by eliminating $t$ (e.g. the whole circle, or both branches of a hyperbola) while ignoring the stated domain of $t$. A restricted parameter domain very often means only an arc, a semicircle, or a single branch is actually part of the curve — always check which values of $t$ are allowed before finalising a sketch.
Check yourself
A curve has parametric equations $x=2t$, $y=t^2-1$ for $t\in\mathbb{R}$. Find its Cartesian equation. (Hint: rearrange the linear equation to make t the subject, then substitute into the other.)
Method
1
From $x=2t$: $t=\dfrac{x}{2}$.
Rearrange the linear equation for t.
2
Substitute into $y=t^2-1$: $y=\left(\dfrac{x}{2}\right)^2-1=\dfrac{x^2}{4}-1$.
Replace t with x/2 in the second equation.
3
So the Cartesian equation is $y=\dfrac{x^2}{4}-1$ — a parabola with vertex $(0,-1)$.